
Most of us are familiar with this idea of dashboards. A quick overview of a set of data, system or project with supporting charts, dials or graphs that emphasize particular points about the data or view. There are some ESRI tools that have been around such as the Operations Dashboard, or the analysis-focused Insights. And now as of the June 2017 update, Web AppBuilder now has built-in functions for quickly creating configurable, informative dashboards on top of your web GIS.

New Dashboard Theme available for Web AppBuilder Source: ESRI
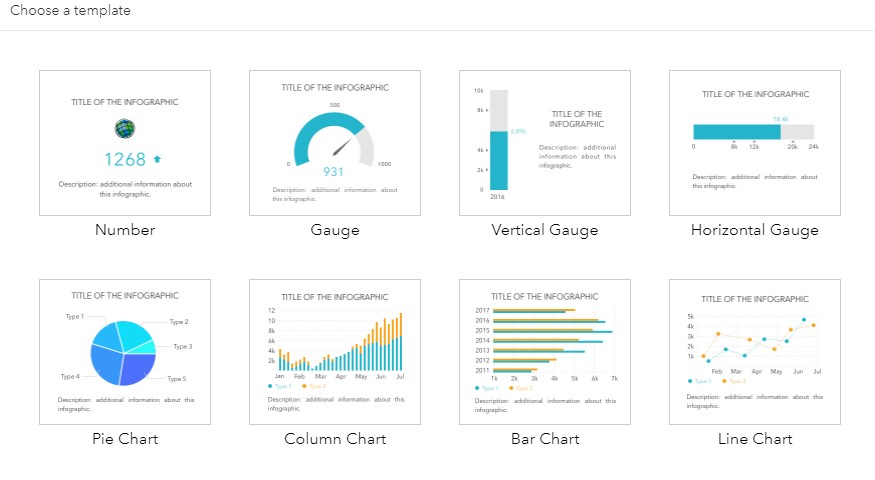
There is a new Dashboard Theme (shown above) designed for just this, and a widget (suite?) named Infographic with a variety of templates to help you build and customize your views:
Infographic templates available. Source: ESRI
I gave it a quick test run using some old demo data and found it to be pleasantly easy to set up and customize, from layer configurations to label text and formatting:
If you have a need or potential for a basic dashboard-themed application I would highly recommend taking a look at this option for ease-of-use, and return vs stand-up time. Check it out.
