With the use of ArcGIS Operations Dashboard paired with tracking devices on snowplows and linked to a Survey123 Problem Reporter, public works departments can manage a real-time dashboard with countless capabilities.
As you can see in this example Dashboard by Esri, some of the key features include a street status pie chart, an average truck speed speedometer, complaints in list view as well as a bar graph, a history of trucks paths, and an interactive map which also includes all those features.
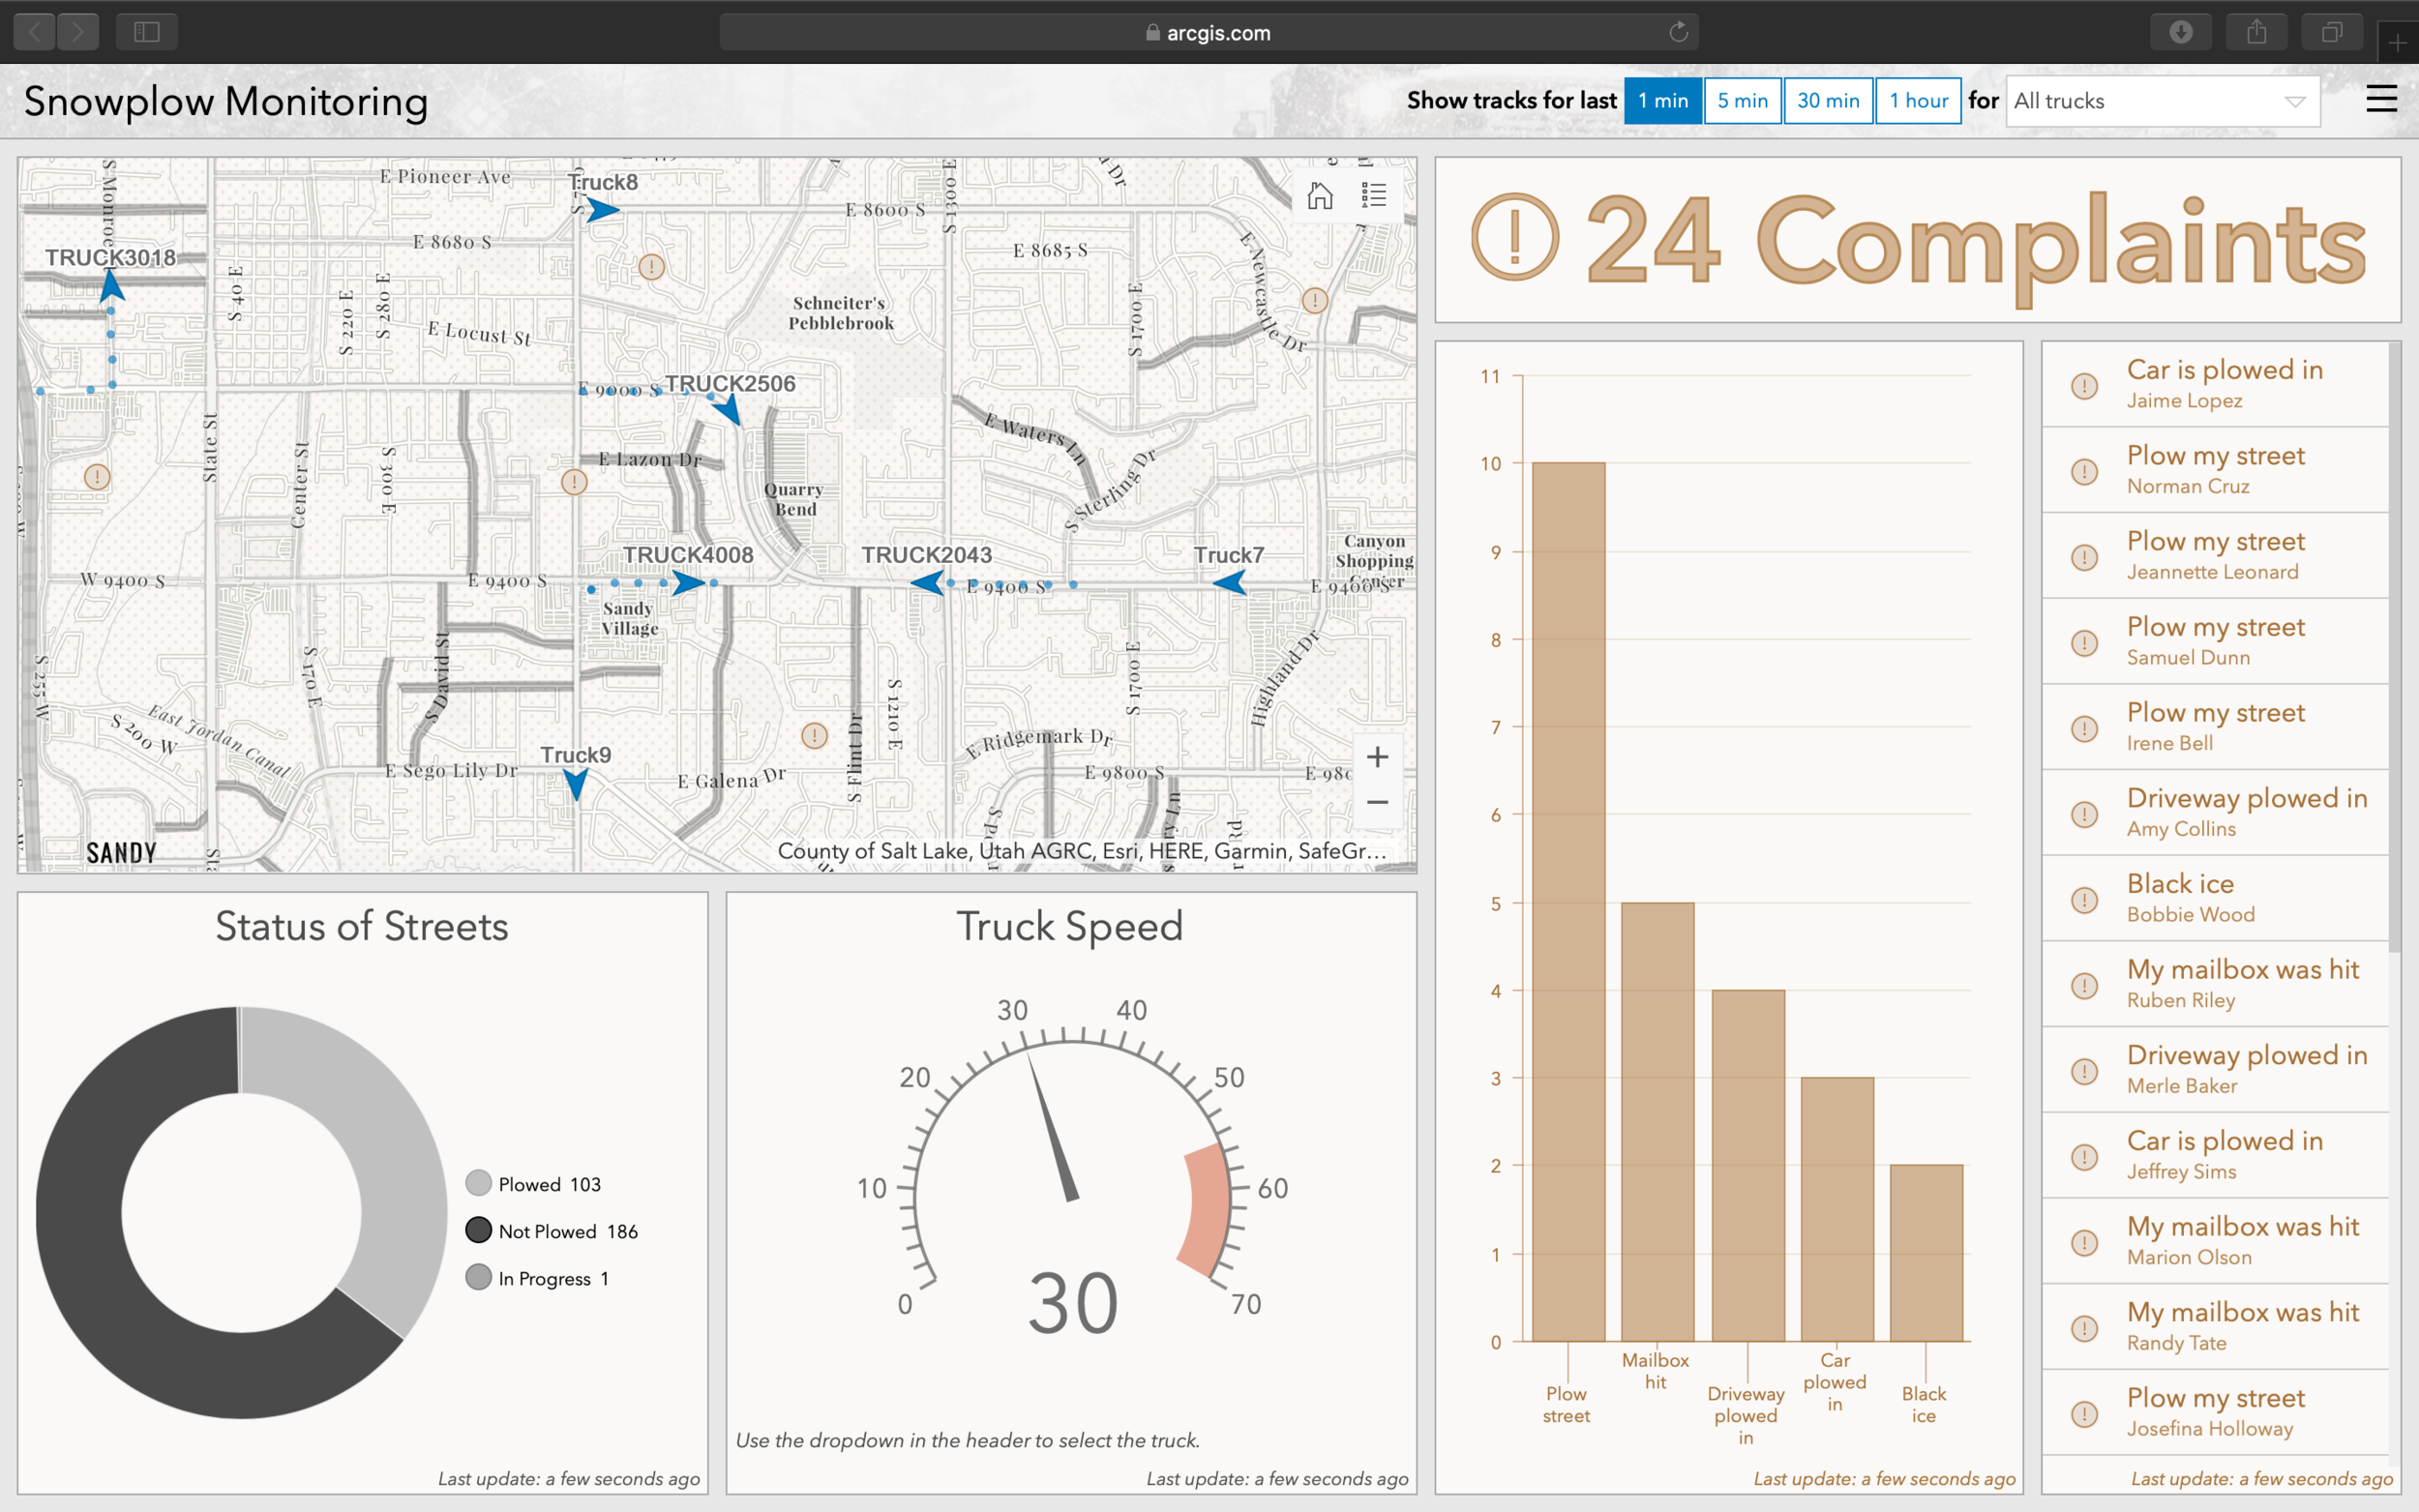
EXPLORE THE FEATURES IN-DEPTH BELOW
Status of Streets tool

The status of streets data is shown in the map when you click on the street, by the color of the street, or in the pie chart.
This data is useful for:
Showing trends of streets that are often not plowed
Interpreting if there is a driver shortage for getting streets plowed in decent time
Getting an overall number or percentage of progress
truck Speed Tool

The (real-time!) truck speed average is displayed by using the speedometer, however you can view each individual truck’s current speed by clicking on that truck as shown with the arrow.
This data is useful for:
Managing a safe team of drivers
Ensuring public safety
Monitoring efficiency
Citizen Complaint tool
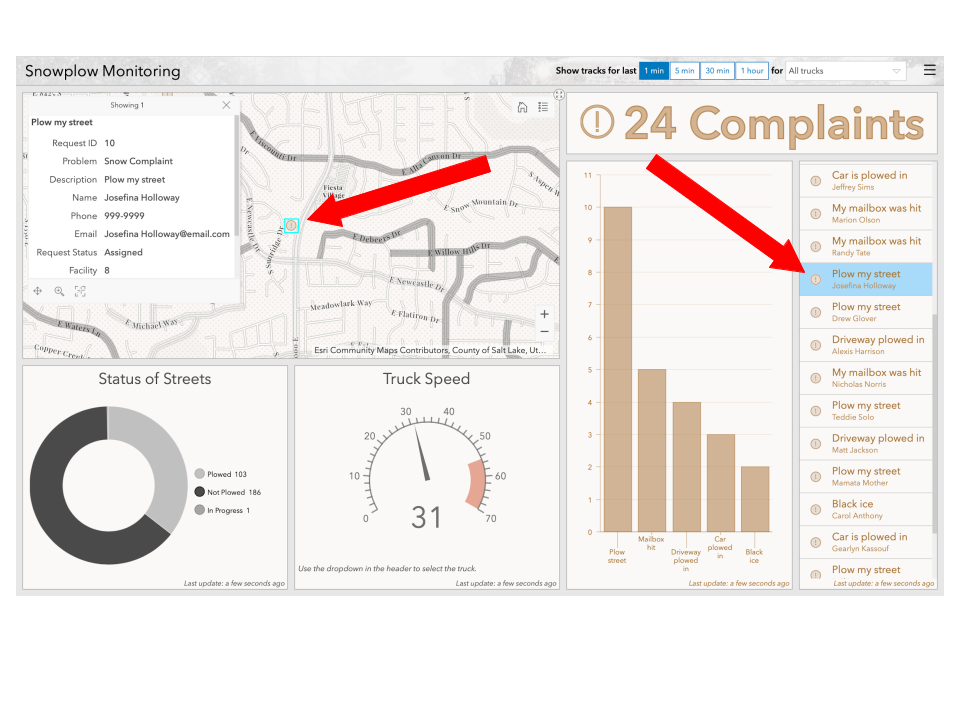
The complaint tool is able to pull responses from a Survey123 survey that would be open to the public in the city. This tool provides a platform for residents of the community to report problems; the department can view, communicate with their drivers, and respond to these reports in real-time.
This data is useful for:
Monitoring trends (e.g., For example, if there are many people’s mailbox being hit on a certain truck’s path.)
Effective use of time for drivers
Shows geographic patterns
Give charge to drivers
Snow plow tracks tool

The snow plow tracks tool allows you to see the history (up to the last hour) of the snow plows, collectively as well as of each specific truck.
This data is useful for:
Expresses patterns and trends
Analyzing efficiency (For example, as you can see in the top left there are breadcrumbs on the main road but not on the unplowed side roads. It would have been most efficient to do those as the driver was passing by.)
