ArcGIS Online

Editing Related Records in Collector for ArcGIS

Editing Related Records in Collector for ArcGIS

Good relationships are important in Business, Sports, Personal Life...in anything, really. Good relationships are important with GIS data as well. Let's take a look at how relationship classes and related data can aid in the GIS data collection process.

A client from a Water Reclamation Department uses the Collector for ArcGIS app to edit Sanitary Sewer Network data. They requested additional attributes for a Lift Stations layer, as well as the ability to add multiple Pumps to each Lift Station. The solution to this request is a related table in a feature service that allows for editing via the Collector app. This is an overview of the process.

Dashboards - No Sweat

Dashboards - No Sweat

Most of us are familiar with this idea of dashboards. A quick overview of a set of data, system or project with supporting charts, dials or graphs that emphasize particular points about the data or view. There are some ESRI tools that have been around such as the Operations Dashboard, or the analysis-focused Insights. And now as of the June 2017 update, Web AppBuilder now has built-in functions for quickly creating configurable, informative dashboards on top of your web GIS.

Mapping of a runner.

Mapping of a runner.

Earlier in my life, I never ran. I mean from bears, sure, probably I would have. I occasionally played a round-ball-type sport that required moving arms or legs quickly. If I had to actually run, I hated every second and  would never consider running for health. Well, circumstances change and different things matter as you approach mid-life. Two years ago I found...

5 Ways to Add a Finishing Touch to Your WAB App

5 Ways to Add a Finishing Touch to Your WAB App

The Web Map and Widgets are the foundation of creating apps in Web AppBuilder (WAB), but there are customizations you can make to add a finishing touch to your app and make it unique.

Prairie State Playlist: A Story Map Music Tour Through the Land of Lincoln

Our travels here at Cloudpoint take us to many places throughout the state of Illinois (as well as many other states). In the spirit of our connections to the Prairie State, as well as our varied tastes in music, here is a Story Map that focuses on a selected set of songs that contain Illinois place names in their titles-The Prairie State Playlist.

The Prairie State Playlist is constructed using Esri's Story Map Journal template. Maps of each location comprise the "Main Stage", while information and a link to the song are in the "Side Panel." The maps for the Prairie State Playlist were created in ArcGIS Online as webmaps, and then converted to apps using Web AppBuilder, which allows for a better interface and the inclusion of widgets such as a Legend, Basemap Gallery, etc. The webmaps alone can also be included as content in the Story Map, as well as videos, images, and web pages.

Please browse the Prairie State Playlist and enjoy the music tour through the Land of Lincoln. Along the way, you might pick up some information about Bob Dylan, Tornadoes, and an EPA Superfund site.


10 ways to use GIS for Sidewalk and ADA Compliance

10 ways to use GIS for Sidewalk and ADA Compliance

Sidewalk inventories and ADA compliance are currently a hot topic among local agencies.  This post will provide you with some tips and ideas on how to use GIS to create and update your sidewalk inventory with the ArcGIS platform via the web and mobile devices.  

Mapping March Madness in Illinois

Mapping March Madness in Illinois

The Illinois High School Association are purveyors of America's Original March Madness, holding basketball state finals since 1908 (Peoria High was the first champion). The University of Illinois had a longstanding tradition of hosting the boys basketball tournament, and the Assembly Hall provided the backdrop of my first memories of watching March Madness on television, as well as the first time I attended in ...

These Pop-ups are Making Me Thirsty: Embedding Related Attachments from ArcGIS Server in an ArcGIS Online Pop-up


In an ArGIS Online webmap, a user can click on a link within a pop-up window to view an attachment, or even embed an attachment stored in ArcGIS Online or in an outside photo-sharing site. But is there a way to embed related attachments (as a large batch) that reside on ArcGIS Server directly within the pop-up windows? We sought an answer to this question while creating a Utility Pole Viewer for the City of Sullivan, Illinois.


After some tinkering, we came up with a solution. There are a few twists and turns in the process, but nothing that suggests getting twisted up like a pretzel (or getting as angry as George Costanza).

First, you want to rename your feature class to [FeatureClassName]_working (or something to differentiate it from the original), and go about the process of enabling attachments on that feature class. Use the Generate Attachment Match Table and Add Attachments tools to populate the attachments in the related table. If you publish your service at this point and view the pop-up for this layer in an ArcGIS Online webmap, this is what you would see...

AttachmentLink.png


...just a link to the attachment.

Clicking that link opens up the attachment in a new browser tab:


That's OK, but we want to see the attachment in the pop-up. Lets take a closer look at the URL in the image above:

We determined that the group of digits between 0/ and /attachments refers to the OBJECTID of the feature class, and the group of digits after attachments/ is the ATTACHMENTID from the related table. However, fields from the related table are not available to choose when configuring the URL for the pop-up image in a webmap-so we need to get the ATTACHMENTID into the feature class attributes.

In ArcMap, join your feature class and the related table ([FeatureClassName_working__ATTACH) based on the Object GUID from the feature class and REL_GLOBALID from the table.

Export the feature class, but turn off all fields from the related table except ATTACHMENT ID and REL_GLOBALID. Give the file name the original name of the feature class. In ArcCatalog, create attachments on this feature class, and load data from the [FeatureClassName]_working__ATTACH table into [FeatureClassName]__ATTACH.

Back in ArcMap, add your feature class to an mxd and publish a mapping service. 

Add the service to a new webmap, enable and configure the pop-up, and add an image under Pop-up Media.

In the Configure Image window, you can choose a field to use as a title (we used ATTACHMENTID), and add the URL where the attachment resides. To get this, copy and paste the URL from the browser tab that has the attachment, and change the digits between 0/ and /attachments to {OBJECTID} and the digits after attachments/ to {ATTACHMENTID}

The result: An attachment embedded within the pop-up window.


Zoom to your Room.

ArcGIS Online has released a new update for November. 

Here is a list of what was expected. 

Among them is a hidden gem that hardly got noticed or mentioned but will change the way we do GIS on the Collector App. 

  • World Imagery, World Street Map, and World Topographic Map will be updated with additional levels of detail in the tiling scheme to support display of larger scale data in or on the basemap. 

Did you see it? No neither did anyone at our office. That was until Paul stumbled upon it while using Collector this week during a data collection project. He kept zooming in and zooming in until all the valves were individually visible.

If you have never come across this, it's a BIG stumbling block for utility folks!  Lots of these guys have oversized hands and clicking on a bunch of tiny dots can really get frustrating.  

This is the difference from an ArcGIS Server Cache to the Esri imagery Basemap

This is the difference from an ArcGIS Server Cache to the Esri imagery Basemap


In the past we have created a tile caches down to 1:500 for ArcGIS online (Or 1:250 if they have ArcGIS Server) this allows our clients to zoom in close enough to see the different features. Possibly click on several and hope the one they want got selected. 

No More!

Esri updated Three Basemaps (4 if you count Labels) World Imagery, World Street Map, and World Topographic Map that now zoom-in to an unbelievable 1:71 !!! I cannot overstate how awesome this IS. Sure the imagery and maps are a little fuzzy but WHO-CARES at that scale you just want to be able to see the features separately. 

If you look into this on ArcGIS Online web map, you can see that it's actually called "Room Level"

**Note if you Don't see this change on the Webmap interface, SAVE your map and try opening it again. AGO is a SAAS, but still needs to update the capabilities of the Webmap. 

Now, get out there you large-handed-gorilla & Zoom-Zoom!


Illinois Roots for these Cowboys' Boots

Statue of Wild Bill Hickok in Mendota, IL.

Being lucky enough to be from the great state of Illinois and having a long lineage of ancestors who called the Prairie State home before me, I have a deep connection to the land and a pride of the heritage and history that the state embodies.  While completing field work in the town of Mendota, IL, I noticed a large metal statue in the town square.  Not ever being to the town before, I decided to go check it out.  Upon inspection I learned that it was a bronze statue of James "Wild Bill" Hickok, a native of nearby Troy Grove, IL. This struck me as fantastic and I decided to dig deeper to see what other famous cowboys, lawmen, and sharpshooters were from Illinois.

I knew that the legendary lawman Wyatt Earp was born in and once called the Western Illinois town of Monmouth home, but I didn't know the vast connection of Wild West names that either were born in or spent time in the Land of Lincoln throughout the 1800's.  Once i compiled a list of several men, I realized that I had to find a way to visualize my state's history that showed how interconnected it was to the vast frontiers and mountains of the American West.  The best way for me to do that was by creating a story map via ESRI's ArcGIS Online story map builder.

You can view the map by clicking HERE.  The process was relatively easy and  pretty fun to put together.  As you look at the map you will notice that the locations have one of three different colors for the tag: blue are for lawmen who once called Illinois home, red are for criminals that have ties to the state, and green is for a man of a completely unique professional background all his own.

To Portal? or not to Portal?

No, not the game Portal. ArcGIS Portal

Last year Esri released Portal with ArcGIS Server as a free extension. There has been a fair amount of confusion surrounding the product. What is it? Should we install it? What is it? 

One things is for sure; Esri keeps talking about Portal (or at least "a portal") so it must be important, right? Part of the confusion comes with issues of terminology. Another is people being unwilling or unable to explain the difference or what clients should do. I want to help with both. 

If you're a Esri shop, ArcGIS Online (AGO) is the platform through which all your GIS will be pushed out to your customers and users. If it isn't now it will be, so go ahead and relent. That platform is a portal (lowercase 'P'). To induce this platform acceptance, Esri decided to giveaway the server-software that runs ArcGIS Online. That is ArcGIS Portal (Capital 'P').  So you're using a portal when you are using ArcGIS Online and you're using a portal when you are using ArcGIS Portal. Get it? 


Now, Should you install and use ArcGIS Server Portal Extension? Probably not. Just use ArcGIS Online. Here's a quick Frequently Asked Questions when is comes to campaign ArcGIS Online (AGO) v. ArcGIS Portal (Portal)


Q: What about credits?  STOP WHINING ABOUT CREDITS, THEY'RE CHEAP!
Q: What about Security? AGO is highly secure by default, probably more secure than your ArcGIS Server installation, which has No security by default BTW. 
Q: Will AGO work with local services running behind my firewall? Yup. 
Q: I don't like my data being hosted on AGO. So don't. the idea of a portal is a window, not a dropbox. 
Q: Do I have complete control over my content? Yup. 
Q: Can the Portal software run on my existing ArcGIS Server? Maybe, but it shouldn't. Are you asking to overload Your PrintServer/FileServer and make it an ArcGIS server too? Recommended Best Practice is to run it on a separate server by itself. 
Q: Will AGO Work without the internet? Ok. Got me there, No. Your users do have to have access to the internet and most subdomains on arcgis.com. So you will have to whitelist a fair number of URLs. Whereas portal can completely be on your internal network. Sequestered. 
Q: If I'm offline, how does Portal get updates to the basemaps? You install them.  
Q: Then how about new tools that are release on ArcGIS Online? You Install those too. 
Q: What about other peoples shared data outside my organization? No Workie.
Q: What if, I am using  Portal and I want to upgrade my hardware to meet customer demands? You cancel your weekend plans. 
Q: Seriously, What real benefit to I get from installing Portal? Your own Domain, Hyper-active-Internal-I.T.-Caveman-Security, Lots of extra work and a reason to spend lots of money on infrastructure hardware, bandwidth & overtime. 

A Portal is a place for connections, like an airport

The security thing could be a genuine issue ... for like the Department of Defense. If you are in local government IT, it really isn't a deal breaker. Does Your server have Multi-Factor Authentication? ArcGIS Online is pretty seamless with ArcGIS Server and plus wouldn't you rather offload some of your bandwidth? In most cases (95%) with city/county government ArcGIS Online will most always meet the orginization's needs.

Not So Lite Anymore

For the first few years, ArcGIS Online was considered ArcGIS-Lite by many of us (including me). Pushing data to the cloud without the need for a server was indeed huge, but capabilities were often not. Even down to the lack of labeling, it was almost extremely basic in many respects. However, those of us who have been using and following the platform have been impressed by the gusto with which ESRI has pursued the enhancement of ArcGIS Online.

Over the last couple of years we’ve seen improvements across the board, from symbology to data storage, from basemaps to analytical capabilities. For instance, data collectors can now take data offline where internet access is limited and sync up when convenient. Or how about related tables - editing related records via the Collector app is finally here. FINALLY. And that’s not to mention the continued improvement to web application templates (there are 24 now, and that’s not including Web AppBuilder) that require zero coding to setup. Even the help documentation is pretty fantastic these days.

So there’s A LOT to be excited about in the world of ArcGIS Online. But right now I’d like to focus that excitement on spatial analysis. You know, that fun stuff that got so many of us intrigued by GIS, but so few of us utilize in the real world. Well ArcGIS Online has had improvements to that side of things to. So what kinds of situations would you find spatial analysis useful? Maybe you’re unfamiliar with the concepts, or maybe it’s just been a while. So here are a few examples:

Proximity and Site Selection

    Displaying areas or features within a specified distance from main roads

    Displaying areas or features within a specified distance from a flood plain

    Finding location(s) within an area containing a certain threshold of elderly population

    Finding location(s) within an area containing a certain threshold of young professionals

    Where can food trucks station based on local rules and regulations

    Combinations of any two or more sets of parameters or specs

Analyzing Patterns

    Determining areas with a high or low density of grocery stores

    High and low clustering (Hot Spot Analysis) of owner-occupied land parcels

These are just a very small sample of uses. Using GIS to perform analysis adds the visual component to the results, or an extra dimension in terms of data. It not only looks cool, it helps with comprehension!


Completely Fictitious Example Workflow

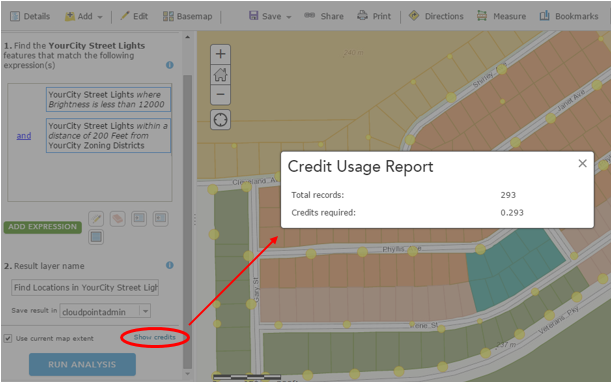
Let's say YourCity is interested in determining dimly-lit residential areas to allocate resources to. There have been a number of complaints and safety concerns, and now there is some funding available. So it is up to you as the GIS professional to assist using GIS as a tool to find and display the best areas to allot that funding.

In this case you are using zoning and streetlight information made available to you.

Step 1: Display Streetlights by Brightness Values

Symbols Sizes by Brightness and Classified by Natural Breaks

Light Symbols by Brightness

Step 2: Determine Residential Areas

Filter zoning layer to only display designated residential areas:

Step 3: Find Existing Locations

Use Find Existing Locations tool to determine where streetlights falling below a brightness threshold are near residential-zoned areas. This will use both an attribute query and a spatial query to produce a new layer meeting the specified criteria.

Step 4: Review Results

Find Existing Locations Results.png

In this small, controlled area it is apparent and obvious where the targeted data fall. However in a larger area, it would be useful to further analyze these results to determine where clusters of dimly-lit areas are located. Those results could in turn aid in the decision making process regarding resource allocation.

Disclaimer: Two things you should always keep in mind - the quality and completeness of the input data, and choosing the appropriate boundary for your analysis, as changing the analysis extent will change your results.


Q: I have desktop. So why perform the analysis on ArcGIS Online? A: The same reasons that you use ArcGIS Online for anything – you can easily share the data through the web. You can dress it up in an application or presentation. And access it anywhere.

Q: What about service credits? A: No worries. First of all it’s not as bad as you might think. Second, you have a chance to see how many credits you will use before you pull the trigger. If it’s too much, you can back off or change your processing extent – but you’ll be surprised at how reasonable it is.

Anticipated credit usage can be reviewed before performing analysis


So there you go. Check it out, or ask someone who has. The spatial analysis capability with ArcGIS Online is here, it’s a great tool - and like the rest of the platform is constantly improving. Look for ways to answer your questions with GIS and add that spatial component that you can visualize and share.