Town of Normal, Illinois Digitizes Lift Station Inspections and Transforms Workflows with GIS
- Cassidy Killian

- Dec 12, 2025
- 4 min read
Within a storm sewer network, lift stations are essential for transporting stormwater from lower elevations to higher elevations, and their uninterrupted operation is crucial to maintaining public health. The Town of Normal Public Works Department performs daily on-site inspections at each of its lift stations to ensure reliability.
For years, inspectors relied on paper forms to record observations, which were turned in weekly for manual data entry into spreadsheets. This paper-based system created delays in identifying issues, introduced transcription errors, and limited supervisors' ability to respond quickly to potential equipment failures. A malfunction could go unnoticed for days, resulting in increased maintenance costs and a higher risk of infrastructure asset failure.
Recognizing these inefficiencies and drawing on his experience with Esri's ArcGIS Field Apps, Dan Wallem, Assistant Supervisor of Public Works, saw an opportunity to replace paper and spreadsheets with a digital GIS-based workflow. The goal was to capture accurate, real-time data, reduce administrative overhead, and enable supervisors to make informed decisions faster, all within the Town's existing ArcGIS Enterprise environment.
Solution
To enhance and streamline the inspection process, the Town leaned on its long-term GIS services provider, Cloudpoint Geospatial, for guidance and assistance to make this dream a reality. The team at Cloudpoint suggested a field-to-office workflow that uses ArcGIS Survey123, ArcGIS Dashboards, and Experience Builder within their existing ArcGIS Enterprise deployment. By further enhancing the workflow's capabilities and coupling ArcGIS Enterprise with Microsoft Power Automate, Cloudpoint delivered the ultimate real-time notification workflow for supervisory staff.
The project was completed through a close partnership between Cloudpoint Geospatial, the Public Works & Engineering Department, and the Town's Innovation & Technology (I&T) Department. The GIS Coordinator played a key role in enabling Cloudpoint to implement these tools within the Town's GIS environment, bridging the communication between Public Works, which outlined operational needs, and Cloudpoint, which delivered the technical solutions. This collaboration was central to the project's success, demonstrating how technology, operations, and innovation can align to modernize critical infrastructure workflows.
Following a roundtable meeting between the staff from Cloudpoint and both the Town of Normal's Public Works & Engineering and Innovation & Technology departments, a project plan and timeline were established. During the meeting, Cloudpoint received examples of the paper inspection forms for each lift station, enabling the project team to outline the future workflow, project priorities, and deliverables. Among the highest priorities for enhancing this workflow was automating answers to as many questions on the form as possible. Cloudpoint began by duplicating the paper forms in Survey123, then leveraged Survey123's built-in functionality to autopopulate the inspector's name, data, and time, along with standard data-entry fields, such as pump hours, that required direct user input.
After initial beta testing by the field staff, feedback was received, and Cloudpoint made the surveys more user-friendly by providing customized in-survey information using question labels and notes, and by adding constraints and parameters for how data was entered in the field within the Survey123 field app. For example, when an inspector entered pump hours, the survey would display the previous day's pump hours as a reference. The form was also designed to limit the answers to certain questions based on the thresholds configured as calculations and constraints in the survey's XLSForm. The survey would display a warning message when an input for pump hours fell outside a standard range, by calculating a dynamic range based on the previous day's pump hours. The purpose of this is twofold: it reduces data entry errors and provides real-time alerts to field staff about issues that may require further investigation while they're still on-site.

Updated Workflows
The digitization of this workflow enabled the development of the new functionality previously unavailable with traditional paper-based inspections. These include automations to calculate the previous day's precipitation amounts in Survey123 and real-time email notifications to supervisors via Power Automate to review each form submission. To receive precipitation information, a custom JavaScript function within the Survey123 form queries data from a National Weather Service station at the local regional airport. The precipitation amount is calculated in a hidden question and then submitted as an additional attribute in the inspection entry, enabling reference and analysis back in the office. This precipitation information is crucial for monitoring the runtime of one or more pumps at a specific lift station that participates in the storm sewer network, and it also helps identify areas where inflow and infiltration are affecting pump runtime. Email notifications are sent whenever a submission violates one or more predefined rules in the Power Automate flow. They can also be manually triggered by a question in the Survey123 form asking users whether they need to send information to their supervisor.

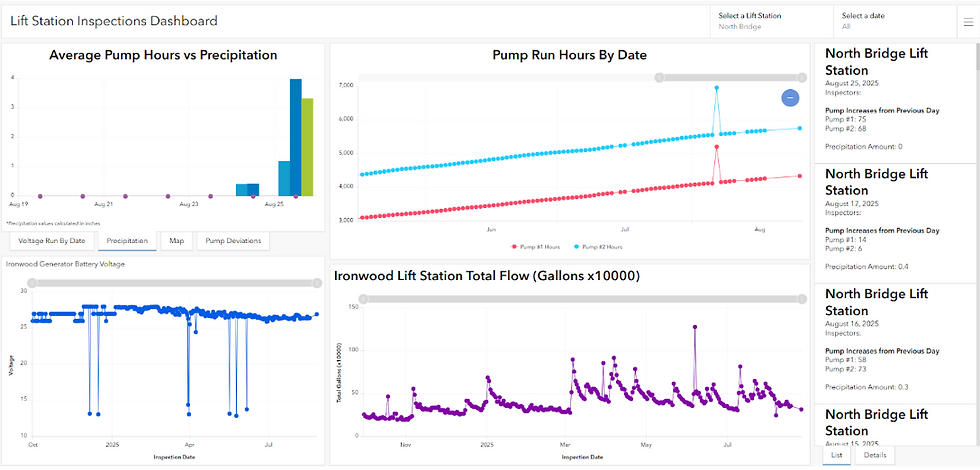
On the office side of the workflow, the survey inspection data is fed into two web applications within the Town's ArcGIS Enterprise. The first application is an ArcGIS Dashboard that displays all inspection data in a series of charts and graphs, populated directly from the inspection data submitted with Survey123. The dashboard provides public works administration staff with a real-time view of the status of all their lift station assets. Most graphs are simple in nature, but provide an easy-to-understand view of the metrics for each station. The second web application is an Experience builder application that provides a tabular view of the data, enabling staff to view and update previous inspections as needed. Even with built-in safeguards for data collection, it is still necessary to provide office staff with the ability to correct erroneous entries to ensure the most accurate data possible.

The new field-to-office workflow has transformed how the Town of Normal manages its sewer lift station inspections. By moving from paper forms to a digital, automated solution, staff capture accurate data in the field, supervisors receive instant notifications of potential issues, and leadership gains real-time visibility into critical infrastructure. This approach not only improves efficiency and reduces risk but also positions the Town to scale its GIS-enabled asset management practices into other areas of public works.


