Two weeks ago we loaded up the family truckster and headed out on a 10 day 9 night camping vacation. No worries: we're campers, it's not a big deal to myself, my wife or my four kids to plan and enjoy 7 days sleeping in a tent.
What's different about this trip was the "urban-ness" of the campground. Greenbelt Park is a nice enough campground. The sites were fairly level, bathrooms tolerable, (see my Yelp review) water was cold and accessible. That's all an aside, what is important now is what I used to navigate from Greenbelt Park to downtown Washington DC and back and getting around while we were down there. Yes we planned on driving downtown, taking the Metro downtown from Greenbelt roundtrip for 6 people was $48.
For a few days I banged my head against the marble walls using Apple Maps and BestParking apps. too frustrating.
This was not a 'no tech' vacation. A flatlander in Washington DC trying to keep track of 4 younglings while searching for the best parking space or photogenic angle of any one of a dozen different memorials NEEDS a smartphone.
Navigation:

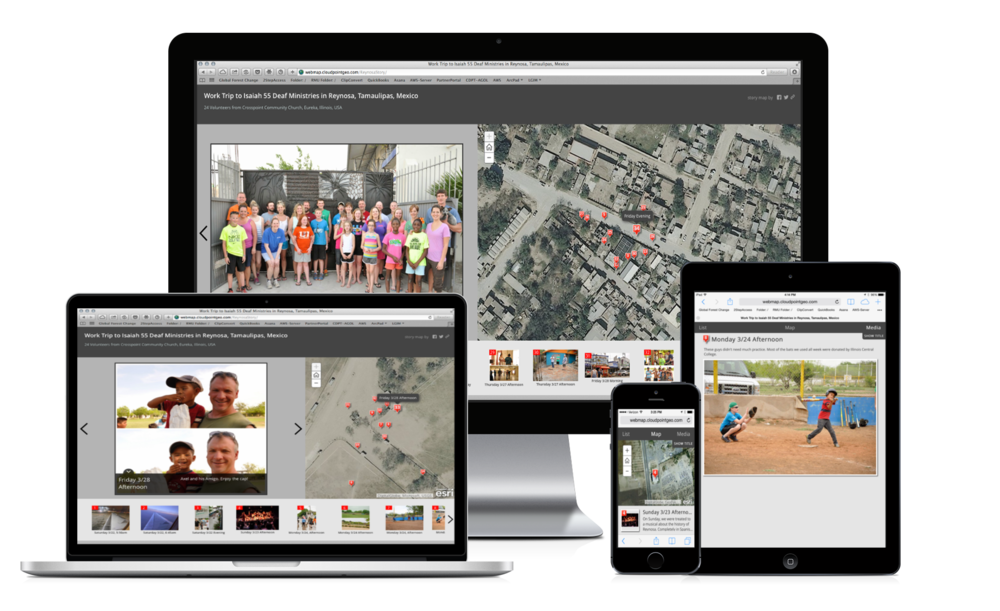
My Daughter figured out the interactive map in about 4 seconds. (pretty sure it's operations dashboard)
My first premonition should have been the LTE. Verizon LTE was spotty, Oh I had coverage, it just seemed to be bogged down. Lots of apps wouldn't work without LTE. Apple maps was one of them. Google Maps? Flawless on 3G. I should have switched then. Also Apple maps insisted that I make a U-turn about every other block, (without missing a turn). Their options are so limited it make me wish for my Garmin eTrex. You don't notice it when you are cruising around highways of Illinois or I-80, but in downtown DC in the height of bumper-to-bumper rush hour traffic, I cannot make a u-turn. Eventually for general navigation I chose Google maps over Apple maps & Waze. The 3-D view of Washington in Apple Maps was cool, but I still say 3D is not practical.
Parking:
The BestParking app never actually pointed me in the right direction, it puts a pin on the general side of the block. want directions? That's an in-app purchase. Also they seemed to advertise specials, or prices for hybrids or some such thing not daily or hourly prices. After a few stressful searches, I ended up using 'ParkMobile', an app advertised on DC's own parking meters. I could even "feed the meter" from the app*. Also just biting the bullet and paying for a parking garage helped too. To find the garage again, I usually marked the location with a star on my Google map app. Simplicity. Did I mention how bad traffic was?
Overall Needed DC apps
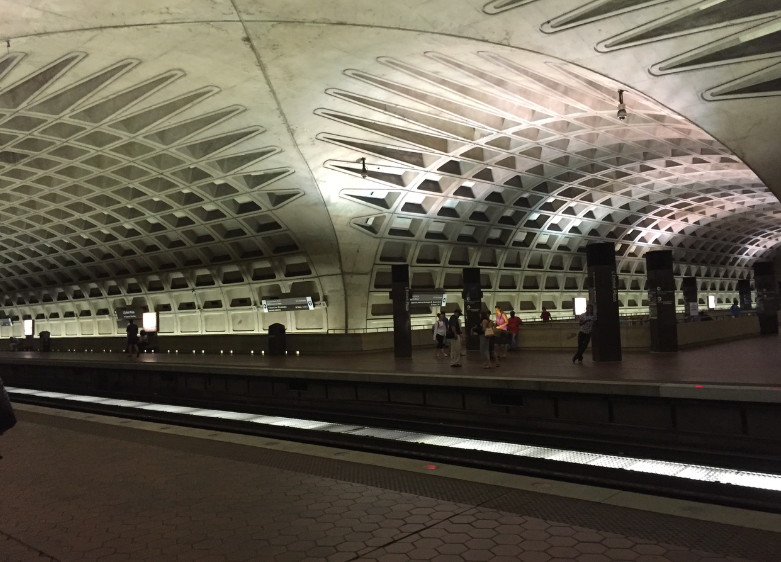
The National Park Service has a GREAT app that's a simple map with pins on it It's called 'National Mall'. I used that map several times each day, it was a life saver and a must-have for tourists. It has locations of main attractions as well as public bathrooms. Note: the National Aquarium has not been around for several years, but it's still on the map. Also on the one day that we took the Metro downtown the best app was the simplest. 'Metro Map' showed your location and the locations of the trains. That's all it did. No planner, no purchase of tickets just a simple map. Done. After that use logic and common sense. Of course when we did splurge and eat out, I used Yelp to find appropriately priced eateries for a family of 6. I also purchased the National Zoo app for $1.99 but that was mostly for Family Share so that my daughters could see the webcam of the Giant Panda cubs.
Lessons Learned.
The simpler the app the better. The Time & Navigation Exhibit in the Air & Space Museum was the best, but the t-shirt is $38. Parking on the street changes at rush hour. It's 2 miles from Lincoln to the Capital. The Potomac is kinda smelly. You can get soft-serve ice cream and $1 bottle waters from street vendors. The Archives charges twice as much for their copies of the Constitution as the Smithsonians. Parking tickets in DC are $100. Security guards in the Capital do not smile. Aaron Shock's office is still red. View from the steps of Lincoln is awesome. Meet Larry the volunteer at the National Zoo.