Using ArcGIS Pro on a MacBook Pro

Pro on Pro (on Pro)

I've committed to learning Esri's ArcGIS Pro. Problem is, I use a Apple MacBook as my primary GIS machine and most software from Esri only runs on Windows. Up to this point, this is no big deal because ArcMap is 32-bit and not very memory intensive. It's been running on Parallels for Mac just fine for 2 1/2 years. Things change. 

ArcGIS Pro Running on Parallels for Mac in 3D

I had played with the Beta a while ago, and it didn't run too well on my current system. The display flickered & stuttered quite a lot and seemed to be constantly loading something. In anticipation for full release of ArcGIS Pro v1.0, I upgraded to the most current version of Parallels (10) and doubled my RAM to 16GB. Unfortunately, these easy answers didn't help with the display, I was still getting jumpy navigation and 3D felt like it was on Windows 2000. Great. Felt like i just blew $200 in upgrades. :-/

Last week during the Esri Business Partner Conference I spoke to a few virtualization experts who were demonstrating  ArcGIS Pro on a virtual machine. (it seemed like they were there waiting just for me!) We spoke about my set up, there was a bit of nose-wrinkling but I looked around and pointed out about a dozen or so Macs throughout the Expo center. You have to do this when you talk about Esri software running on a Mac. Do I even need top point out how Apple was the only PC maker to have double digit growth in the past year?  Point is there will be a lot of people trying to figure out how to run ArcGIS Pro on their MacBooks and the folks at the conference helped me out so I pass along that info to you: 

Very UnOfficial Benchmark Testing In ArcGIS Pro in Parallels and VMware Fusion
  • Don't use open source virtualization. Virtual Box is nice if you aren't doing anything serious but doesn't have the options or horsepower that a production machine requires. VM Ware Fusion and Parallels are virtually identical in benchmark testing with ArcGIS Pro. 
  • Do upgrade your RAM. I moved from 8 to 16 and dedicate a full 8 GB to my virtual machine. Parallels allows me do shave off another 2GB to the Video Memory still leaving 6 GB to run the MacBook. 
  • Do use DirectX9 instead of 10. I know this is counterintuitive but the virtualization experts told me that ArcGIS Pro uses DirectX11 by default if it's available then jumps down to DirectX9. There is some compatibility issue with DirectX10. Parallels has options for OpenGL, DirectX10 and DirectX9. My video stuttering problems STOPPED when I chose DirectX9. 
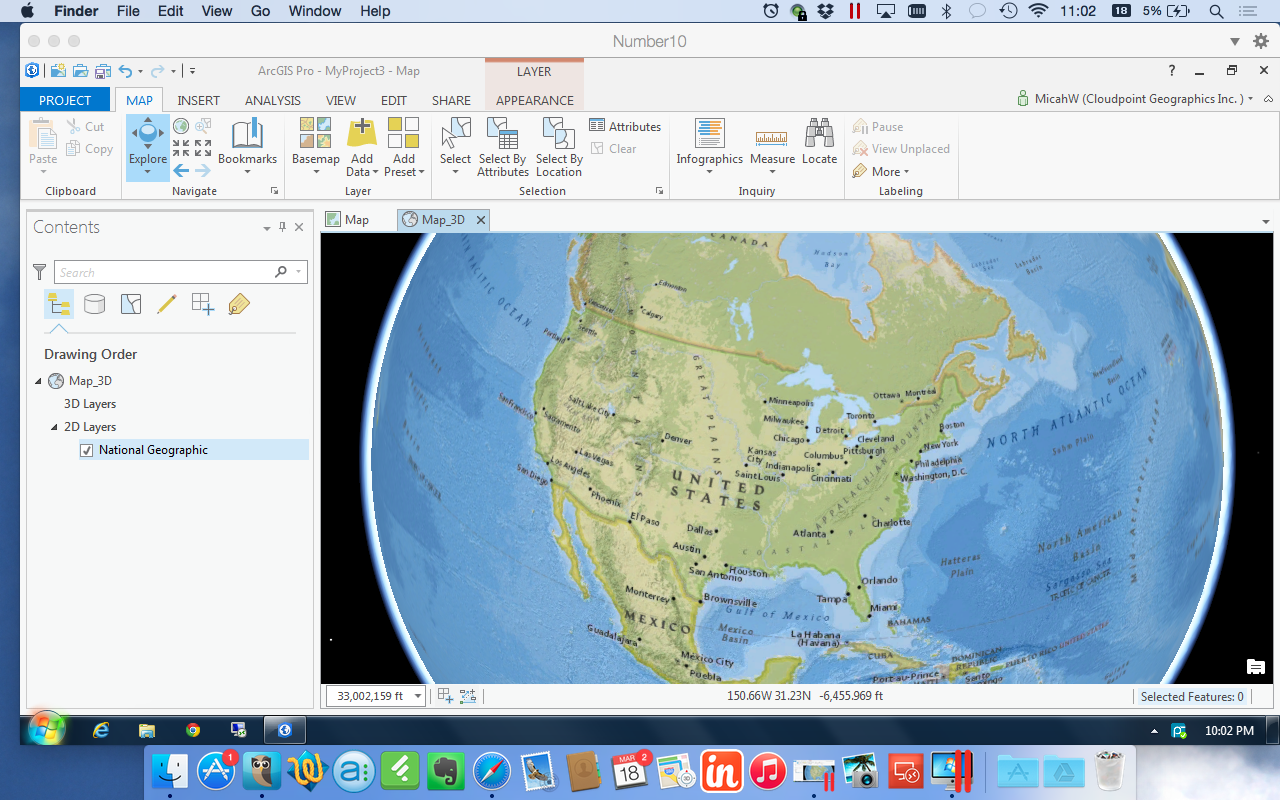
  • Do change ArcGIS Pro Display Options. Go ahead and monkey with the settings a little. Make sure your 3D accelerator matches your VM host. Enable Vertical Synchronization, and test the Speed --|-- Quality slider. I also set my system to delete the cache after I close the project. 
  • Do use a host machine with a Nvidia Graphics card. MacBooks with Retina displays usually have one of these but you can check to make sure. Unfortunately, I do not. Download the 'Clear Sailing' Nvidia demo to test your system. 


Final Notes:

Every system is a bit different. ArcGIS Pro is programmed to use a GPU if it's available. My Expert friends inform me that VMware Fusion leverages the GPU for 3D acceleration, but does not support GPU true pass-through. Parallels tries to create a virtual GPU by assigning RAM directly to 3D acceleration but it's not a direct GPU either. Look for this technology to keep advancing. I an a firm believer in SSD drives. I have two right now, one is completely for the Windows VM. 


Disc Golf

This started out as a simple smartphone GPS(GPX) trace. A trace to follow the route through a local course, which I could later add to my own map. Of course that map had to include the beginning and ending for each hole – tees and baskets. Nice! And easy! …Hmmm maybe way too easy. Decided to digitize the surroundings in ArcGIS for Desktop to really make the course stand out. Some of the data was available, but most of it did not meet the quality standards I was after – so I ended up becoming super-efficient at a variety of digitizing techniques instead. Note: I did and still do turn to Google Maps for reference in their top-gun imagery. In your face, everyone else’s imagery.

The first result was not bad, and caught the attention of the right people at the right time. It just so happened that a prominent local tournament could use such mapping for a few area courses. Sweet.

The first course, fairly refined. Washington Park, Washington IL

It's been great so far. Courses are a nice size for weekend projects, and contain a good variety of features to work with. Oddly enough, what I consider the biggest challenge to date has been depicting trees. When canopy is sparse, you can drop points to represent trees and shrubs, but that gets to be tedious rather quickly. And finding the best way to get those points to display at a quasi-relative circumference can also be WMTTD (Way More Tedious Than Desired).  Other options used include tracing the boundary of thick canopy areas or my favorite, extracting them from DSM (takes a billion mouse-clicks off your finger, but you still spend enough trial and error time finding that perfect set of values that your default gdb looks like its ten years old).

Sneak peak of the temporary course at Eureka Lake Park, Eureka IL

No matter what methods have been used, a number of new tricks were picked up along the way that fulfilled certain needs and have made for easier going moving forward (hooray GIS). This has been a great example of utilizing the technology for a practical use while coupling it with an enjoyable pastime. Not to mention it will help in a small way to contribute to both the disc golf and local communities. Win-Win.

ArcGIS Pro Demo-nado

OK. The GIS World has had the much anticipated ArcGIS Pro for about 3 months now, and everyone is still using ArcMap. Why? Because change is hard. 

Geo-Professionals should really change that, because ArcPro, Pro, ArcGIS Pro, AGP whatever-we-call-it is actually a pretty good product. YES, it has some shortcomings, as most first versions do. However, in a very unofficial tally from a group of 12 GIS professionals, the good outweighed the bad 8-5. Not a blowout be any means, but a positive result nonetheless. 

It's no surprise that we (Cloudpoint) are behind the product. Ok, I am. I recently doubled my RAM in may MacBook in-part to be able to devote more speed to Parallels to run ArcPro. It runs well too! Drawing does slightly stutter when in 3D but that doesn't matter because I have yet to be convinced that my clients want or need 3D GIS.

I digress. This morning I created the two videos below in order to demonstrate ArcGIS Pro and several of it's best qualities (not 3D). The videos are fast paced, packed full and I kept them between 6 & 7 minutes. This is not GIS training, you can't train any person GIS in 7 minutes, let alone on a new piece of software.  I hope you enjoy them and then download your copy of Pro to try it out. 


  • In this first video of a two-part series, We simply walk around the interface and perform some SIMPLE actions. Opening a Map, Editing map notes and understanding what happens.


  • In this Second video of a two-part series, we will talk about importing an ArcMap MXD, Editing and touch briefly on navigating layouts. 

Please leave a comment on YouTube if you like it. 

Live Maps inside a presentation using Bunkr

If you have an ArcGIS Organizational account, you already have license to use Esri Maps for Office. It works really well and enhances your presentation from the boring screenshots of maps we have all grown numb to. 

BUT! What if you don't have Microsoft Office? (there are a few of us) Or you use a MacBook or ChromeBook or UbuntuBook(?). Never fear, You can still embed your maps into a presentation using the Newly improved Bunkr App


Bunkr has been around for a few years. However, they very recently Re-built themselves from the ground up. The streamlined tools and formatting will not appeal to those who are heavy powerpoint wingding/clipart/rainbow-font graphic users. It's a very minimalistic design. Which I respect, because presentations should focus on what the presenter is saying and slides should reinforce what is being spoken. Infact, I uploaded on of our graphic-heavy canned presentations and Bunkr essentially imported them as jpegs. 

Instead, Bunkr focuses on web-data; stuff already on the web. Yes, it's cloud-based. No, you cannot download a presentation. No, there is not animation. Deal with it. You can however pull in Google Drive, Dropbox files, Instagram feeds, Pintrest boards, YouTube Videos, Grooveshark Playlists, Time/BBC/TechCrunch/Wikipedia Articles, images from anywhere, Code from Codepen ... and on... and on. Seriously, the current list is about 75 different online services and the application is still in beta. (You can open and read PDFs!)

Get to the Maps man!

At first I was excited to see the ability to embed code. That way I knew at least I could share a CodePen and display the results. I've played with that service before. Using it to keep, test and maintain good iFrames of embedded maps from our ArcGIS Online.  In the example Bunkr presentation below, the first map is this CodePen. It works ~fine~ and the display isn't 'horrible'. Still, it is using another service to 'host' your iFrame, so there is some funkiness there, not everything displays exactly like you want. 

Then I Learned that to display the Google Drive document, Bunkr requests the iFrame code directly. So, I tried the next logical step and inserted the whole code snippet from my shared ArcGIS Online map. BOOM! Complete slippy map in a presentation format. Here is the presentation to truly understand what I mean. 

The only downside is that the code snippet is gone. You can't make those slight edits or adjustments on frame size. Once it's pasted and the slide is created, there's no editing. You just create a new slide and re-paste. So, I'll probably keep a list of embeddable iFrame code snippets somewhere, like I do now. 

Awful presentations are usually the cause of fatigue and skipping out early on work. Engage your Audience with interactive maps.

Awful presentations are usually the cause of fatigue and skipping out early on work. Engage your Audience with interactive maps.

You might be saying: "Seems like a lot of work to just display a ArcGIS Online map. Why not just link it to Your Powerpoint?" Well that's a valid point. However, if you want a smooth presentation and the ability to easily pull in MANY different sources from around the web, sometimes switching back & forth from Chrome to Powerpoint to Crome again gets tiring for the viewer. You've seen (or YOU have presented) those kind of maps, the presentation is constantly switching from browser to Powerpoint. And if the screen resolution is extended and they have to draa-aag the browser onto the correct screen, then eventually the presenter gives up and doesn't go back to presenter mode and just stays on the editing view.... ugh. you know what I mean? disconnected and confusing presentations are poor presentations. 

That's really what makes presentations awful: Presenters don't often enough think about the audience. 

FalseNorthing Blog Re-Visit: Open Source Elite

I use to have a personal Blog (Like 90% of Westerners) that I maintained regularly with rants and revelations. This post is a copy from an Archive of that blog dated Feb 3, 2012. It was written during my capacity as GIS Manager at Peoria County but the sentiments are the same. 


Watch out! The gloves are coming off!

Old boxing gloves to fight against Open Source GIS elitism. 

I’m really tired of GIS Professionals who brazenly tout their own wares, talents and data while demonizing much ((Much) MUCH) larger companies for selling theirs. Listen, It’s awesome and cool that you do what you do for our Geospatial Industry. I won’t deny there is a little part of me who sorely wishes I was like you; on my own, working when I want, where I want… but please, ease off the hate.

You can use all the Open Source software you want, it’s cool, really. I use some myself. But please don’t make those of use who primarily use Esri products out to look like drooling buffoons blindly paying maintenance and scarfing down every crumb off Redland’s table. I imagine a select few of you sipping on imported wine laughing through their nose about some idiot who uses ArcMap at a small county to update the zoning shapefile (Esri’s formerly proprietary file-type which they opened up). “Ah-ha, Ah-ha. and he actually continues to pay maintenance!” “Har-har. Doesn’t he know he should put that into a fusion table and edit with Q-GIS then replicate to PostgreSQL for enterprise distribution?!? -For Free*?! What a buffoon!”

Our industry must have balance, competition and choices to thrive. I’m cool with Open Source GIS having a strong community around it. Sometimes I even feel like part of that community. I really like the philosophy and idealism behind it. What gets under my skin is the constant railing against certain companies just because they’ve been successful or they have a different business model. Or, when that venom is directed at the purchasers of aforementioned proprietary software. It makes me feel like I don’t ever want to work with/at/for certain open source elitist-GIS Consultants. It is simply unprofessional. But then again, We’re an Esri shop. So, I probably won’t have to.

Ahhhhhh. There I feel better.


HA! I used to be funny!

A Look Forward: No Predictions, Only Productivity

Don't fall into the trap of thinking you know anything about the future. Sure, There's lots of neat confucus-iy quotes about knowing the future from learning about the past, or whatever. I've succumbed to the temptation myself to guess what will happen in the next 5 years. Here's the real deal. You can only control the "now".  Even then just a little tiny corner of your world. The future is ever changing,  take a lesson from Yoda.

Here at Cloudpoint, we are developing Principals to work by and not procedures or policies. We have no employee handbook or workplace guidelines. Even if we did it would be filled with bullet-point list of adages. For Example:

despair.com

  • Be Professional.
  • Work Hard & Be Nice To People.
  • Are you Productive or Just Being busy?
  • Make it Better. 
  • Why are you here?
  • When the door is shut, don't bother me.
  • Never Stop asking Questions.

When you feel like you can (or try to) predict the future, your pride gets in the way of actually making it happen. Somewhere inside you become a spectator watching life rather than a participant in it: "I knew this was going to happen!" Not helpful. A bit of personal humility can go a long way when you are assisting people with a new technology. Rather, when you set attainable goals you set a standard for yourself, a personal guideline. American author Mark Batterson once said (paraphrased): 'Goals are Just Dreams with Timelines' Well Said, Everybody needs dreams. 

This is what 2015 looks like for us. These are our genericized Goals: 

  1. Increase Benefits to Team Members
  2. Expand our Territory
  3. Hire
  4. 7+ Speaking Engagements
  5. Learn New Software
  6. Read 13+ Books
  7. Freely Distribute Several Useful tools
  8. Centralize Cloud Offerings 

There are others that I'm not willing to share, but this is most of the list from our first 2015 staff meeting. Some of them are personal, some are corporate all are real and attainable. 

Don't let the lure of trying to predict the future fill you with apathy and pride.
What are your goals? 

A look back: Cloudpoint's 2014 Year in Review

First Flight: We've come a long way from Kitty Hawk, NC

 First flight of the Wright Flyer I, December 17, 1903, Orville piloting, Wilbur running at wingtip.  http://en.wikipedia.org/wiki/Wright_brothers


First flight of the Wright Flyer I, December 17, 1903, Orville piloting, Wilbur running at wingtip.  http://en.wikipedia.org/wiki/Wright_brothers

 A close up of one of the props on Cloudpoint's first quadcopter which was later dubbed "Icarus".


A close up of one of the props on Cloudpoint's first quadcopter which was later dubbed "Icarus".

It's been over 111 years since the birth of powered aviation and its amazing to think of where we've gone.  Cloudpoint conducted its first successful GPS-guided aerial mapping test flight on June 9, 2014 at the Roanoke Apostolic Christian cemetery.  Height: 150 ft, Speed: 6 mph, Flight time: 8 minutes


Mapping at Sonic Speed

 Cloudpoint's new Chevy Sonic with almost the whole crew loaded inside.


Cloudpoint's new Chevy Sonic with almost the whole crew loaded inside.

In July we purchased our first company vehicle, a Chevy Sonic, from Sam Leman in Eureka, IL.  The logo and lettering  by Kat-n-Mouse Graphics of Roanoke.  This has been a great vehicle for us as we put many miles on traveling throughout the state to our various clients.


Signs of Success

On May 1 we successfully rolled out our first custom application solution called SignOps, a sign inventory management solution using barcode tags for asset management.  LaSalle County was the first project where we tagged over 6,000 signs with barcodes and provided a complete turn-key mangement solution with the SignOps application.

5 Christmas Gift ideas for the Geogeek in your life.

I admit, this is quite the "Wish List" from your rich Uncle Montague. But they're neat to dream about and hope for someday. 

In no particular order. 

Screen Shot 2014-12-10 at 8.48.29 AM.png

1. Land Carpet.
Who doesn't want to stretch out on a map? Because paper is not really inviting, how about a map made out of genuine New Zealand wool? (did you know there are 7x more sheep in New Zealand than people?) Awesome. However at $2100 for a 6'x8' area rug, it's not for the typical GIS Technician's budget. Something a little more reasonable is the I Am Here Custom play-mat


2. Map Wheel
I know where I am, most of the time. The Map Wheel is a distinct custom made reminder of where that other place is in reference to wherever I call home, or whatever location you choose to be in the center. Kind of like the Direction Pole in the TV show MASH. A custom Map Wheel is about $100 US with about $10 shipping, but it's made in Australia.... soooo, it might have to be a Valentines Day present. 


3. World Map iPhone Case
Easy. $30. Wood. Looks nice. Made in Indiana by a guy named John, how American is that? Boom. Get it. Only for 4/4s & 5/5s. No iPhone 6 or 6+ yet. 

 
Screen Shot 2014-12-10 at 9.18.13 AM.png

4. Fitbit Surge
I like GPS & I am a watch wearer, but I'm not holding out for a Apple Watch. They look cool, but I don't have that kind of cash. Plus there are literally dozens of other smart/fitness/GPS/bluetooth watches on the market. I like a rectangle design and the Surge price tag of $250.

 
Screen Shot 2014-12-10 at 9.20.47 AM.png

5. Hand Made Globe
uh. I've tweeted about these before, and actually gotten a response from the folks at Bellerby & Co. These are amazing - beautiful - works of art made with care, precision and an obvious personal touch. My wife would grab her Scrapbooks running out the door in case of a home fire, I would grab this globe. Especially since the desktop version is about $1700 US. Save your pennies kids! Someday. Someday.


There you go. 5  rather unrealistic and completely unnecessary first-world presents to get for your resident geographer to celebrate Christmas.  
Got any other Ideas? Put them in the comments. 

Centimeter Topo from 400 Feet

It is hard to deny that UAV technology is not going to impact many industries. With the lack of FAA regulation keeping commercial use grounded, gaining experience is hard. In an effort to test and develop our UAV imaging portfolio Cloudpoint Geographics has developed a solutions package.  

Cloudpoint is striving to bring affordable imagery to industries such as mining, agriculture, engineering, and undiscovered markets. The value of affordable imagery that can be flown daily can help decision makers perform tasks by giving them tools to conduct stock pile volume calculations, topographic surveys, crop analysis, and many other needs. Cloudpoint's history as a geospatial solution provider allows us to use advance GIS and image mosaicing software to generate 3D deliverables.  

junbo classified.png


How We Do It!!

Creating such results comes from combining various technologies to create a package. UAV's are just the flying platform and must be assisted by ground control, a good camera, and powerful processing software. Software algorithms, such as Agisoft Photoscan, are used to stitch photos to make a large mosaic as well as calculate elevations. This 3D model then can be exported as a point cloud, DEM, or one of many other formats. The imagery and 3D models created from images can then be used for many tasks such as volume calculations and Topographic modeling. 


Real world Uses

- Daily Stockpile Volume Calculations

- Better Imagery for any situation

- 3D Building extraction

- DEM or Topo creation


Related Links:

Roanoke Jumbo Profile Tool

Cemetery Application

Image Processing With A Drone

What are we up to in the next 30 days?

October will be a busy month for us!  We have several upcoming conference events that we will be at and hope to see you there.  Be sure to stop by our booth for a visit if you are attending any of the following:

October 9, 2014- IACE (Illinois County Engineers Association)- Peoria, IL (40.693932 , -89.591996)

IACE.JPG

Here you can catch us at our booth or providing GIS training for the County Engineers.  As part of a new technology twist, the association has decided to offer GIS training as part of this year's conference.  Micah and Jon have some great experience to share as former County officials and will provide a hands-on look at the latest GIS applications available for highway engineers and a lot of "how-to's" mixed with it.  Also don't forget to check out SignOps, our latest sign inventory maintenance solution.


Micah Will be presenting at the Wisconsin Esri Users group in Wisconsin Dells on October 20 & 21st. He will be giving a talk on ArcGIS Online for daily use similar to on given in Springfield Illinois last month in August. Since there will be several of our esteemed Esri colleagues present, hopefully he'll keep the ribbing to a minimum (hint-hint).  


October 27-29, 2014- ILGISA (Illinois GIS Association)- Lisle, IL (41.807391 , -88.110383)

Jon will be speaking on at this conference on Tuesday about using the parcel fabric and Matt will be sharing about GeoEvent Processor.  We also plan on giving away something "really big" as a door prize so don't miss out.


October 28-29, 2014- ILRWA (Illinois Rural Water Association)- Utica, IL (41.315869 , -89.01107)

We always appreciate the relationships that we have formed with the good folks associated with ILRWA.  Some of our best clients were generated as leads from this group and we continue to see them each year supporting this great organization.

10 Reasons to migrate to the Parcel Fabric

As many of you know, the parcel fabric concept has been around for quite some time but many have been slow or hesitant to adapt to it.  In this entry, we would like to take a brief look at some of the advantages of using the fabric and try to answer some questions such as "Why should I migrate to the parcel fabric?" or "What real benefit will I receive from an ArcGIS solution for maintaining parcels?".  If you haven't already done so, chances are you will soon be taking a serious look at what it takes for you to migrate your polygon parcels into this model.

1. It's A platform solution- One of the clear advantages of having a platform solution is that you don't have multiple vendors supplying multiple solutions.  You already use the ArcGIS platform and pay a healthy maintenance subscription so why not take full advantage of the dollars you have invested in your COTS (commercial-off-the-shelf) solution.  You will not only save money from that end but there is a good chance you will be on the same page as your neighboring agency.

2. Everything is tied together-  If you have been maintaining your parcels in a simple polygon layer you have undoubtedly found times when you have overlap in your polygons.  This can cause many frustrations when editing and not to mention the spatial inaccuracies that come along with it.  The fabric avoids overlaps by allowing your parcels and boundary lines to "move" all together.  Instead of adjusting 4 different polygons when a corner point moves, why not tied it together so you only make one change everything else adjusts to that change.  The fabric allows you to make these adjustments with ease saving you time and money.

3. The Parcel Editor Toolbar- esri has the parcel editor toolbar available as a free add-in that contains multiple tools and menu commands that help simplify the workflows involved with maintaining parcels and control points.

The Parcel Editor Toolbar helps bring the fabric to life

4. Parcel Workflows- The Parcel Editor Toolbar also contains a menu for automating parcel editing workflows.  Merging parcels, splits, subdivisions, imports from CAD, and boundary line adjustments are all made easier using these workflows.

A screen shot of esir's Tax Parcel Editing Map template

5. Tax Parcel Editing Map- All of the parcel types, whether, tax parcels, subdivisions, lots, or encumbrances (also known as easements) are stored in the fabric as one feature class, however they are separated by types and layers in a sample map you can download know as the Tax Parcel Editing Map.


6. The Plan Directory- Another freebee built into the parcel fabric data model is a table for storing information about record drawings, plans, survey plats, or other legal documents used by surveyors and engineers to describe their findings.  This related table allows for user-friendly entry and interaction with the plan's corresponding parcels to store information such as Name of Surveyor, Survey Date, Document/Plan Numbers, etc.  You can create and maintain plan record information for each parcel or subdivision within the fabric or take it one step further and link the source document directly to the GIS.

7. Spatial Accuracy- You might be telling yourself "I really don't need survey accuracy for my parcels" but with each control point you add to the fabric, whether from the City/Town, County, Private Surveyor, or Federal sources; it allows you to refine and adjust your parcel fabric for greater spatial accuracy.  Its not uncommon to adjust your fabric over time and achieve spatial accuracies down to just a few inches or less with respect to the real world. 

The historic parcel layer helps keep a record of past changes and is automated from the workflows.

The historic parcel layer helps keep a record of past changes and is automated from the workflows.

8. Historical Parcels- Many times we hear of the need to go back and look at what the parcel ID's or layout prior to a split or annexation.  The parcel fabric has a layer specifically designed to maintain the historical parcels and the great thing is that its completely automated.  When you step through the workflows it will prompt you if you want to create historic parcels from your new changes and by doing so it keeps a well documented history of your land records.

9. Local Government Information Model (LGIM)- The fabric allows you to enable information models such as the LGIM which many are already using.  This may save you a lot of time up front so you don't have to 're-invent the wheel' providing out-of-the-box tools for working and interacting with your other land record data layers.

Here is a parcel that has been subdivided into lots and easements including drainage, utility, and ingress/egress.

Here is a parcel that has been subdivided into lots and easements including drainage, utility, and ingress/egress.

10. Standardization- Isn't it nice when we are all on the same page and speaking the same language.  Using the parcel fabric allows us to have a consistent form of naming convention and storing data to help when we are interacting with our 'neighbors' or as GIS users or managers transition in and out of jobs its nice to have familiar data formats to build upon.

As you continue to expand your use of GIS technology, I hope you will find the parcel fabric as a very useful tool for maintaining land records in a clean and simplified format.  We will be discussing the process of migrating your data to the parcel fabric and explain some "do's and don'ts" in an upcoming post.

What is a 'Location Strategy'?

Sounds like a buzzword.

Yeah, it is, So? The point of buzzwords are to create buzz around a specific topic or idea. 

Therefore; The idea of conceptualizing your organization's Location Strategy is to get you to think about location. Some of the worst business advice is given by Hollywood; "If you build it, They (he) will come". Not necessarily.  Here's some questions to start you off: 

  • What would happen if you moved your office/business?

  • Is it important to know the location of your employees? 

  • Is it important that they know where your inventory (Stuff) is?

  • Do YOU know where your inventory is? How about your replacement?

  • Can your clients get to you? 

  • What about social media?

  • How close are you to your most valuable clients?

  • Are you causing your clients frustration because you haven't though about this?

Let me give you two examples

1. Bob the Restauranteur, He makes truly awesome Pizza, but never gave a thought to location. So he opened up his shop in his hometown. He has a short commute but he drives an hour everyday to get fresh ingredients. His little town already has two pizza places, but he has low-overhead, so he stays. He has a great website, but it's not mobile enabled. His kid brother is the delivery man, who seems to deliver a lot of pizzas to his friends outside town. Yelp had a few bad reviews of Bob's delivering brother.  Bob lasted 9 months then went out of business. 

2. Sue the City Administrator, works in the same town as Bob. But she HAS thought about Location, a lot. Infact she regularly updates her digital infrastructure (GIS) on an iPad when sewers get fixed or installed. She also keeps up with her field folks sending them paperless work-orders based on a mobile-enabled app from the general public, which are her 'customers'. She has claimed the locations of city hall on Bing and Google maps, Yelp, Foursquare, and a host of other social media. Sue is 63 and almost ready to retire, so she's training the current public works director to do all of this and sends him to lots of conferences. 

A good location strategy is beneficial to you presently and those around you in the future. With these little self-aware computers we all have in our pockets, location is common. Someone will think about your location if you don't. My advice to you is get in front of the tide. Think of some of the most effective companies; Walgreens, McDonalds, Wal-Mart, Casey's General Stores. These guys know the value of a good strategy. Location, Location, Location. 

Rochelle Municipal Utilities: Zero to Hero

Let me lead off by stating the obvious, This project is not complete!!! We've invested a lot of time and energy into RMU and when we were asked to write a summary of where GIS has brought them in the past year, I jumped at the chance and wanted to post it here as well. The Following article has been circulated around their various committees and councils and so we present it here. 

1402517536505.png

In June of 2013, Rochelle Municipal Utilities Electric Department moved forward in several significant ways to become more efficient in the use of Geographic Information Systems (GIS) They invested in a three-year Enterprise License Agreement (ELA) from Esri Inc. of Redlands, CA for their GIS software package.  This license agreement allows RMU to utilize any and all of the industry-leading Esri software site-wide, as-needed. In conjunction with this agreement RMU purchased a high-end server environment for implementing this software. As well, they 

“Putting our Electrical Depa-rtment records into a GIS has allowed us to communicate more efficiently with office and field staff.”

— Al Corl, Electric Dept. CAD Supervisor

entered into a contractual agreement with Cloudpoint Geographics Inc. of Roanoke, Illinois for set-up and geospatial consultation services. 

Previously all of the Department’s spatial data was stored in AutoDesk CAD format. While accurate and exceptionally maintained, the CAD data was housed on local workstation hard drives. Disseminating the data was complex and not easily achieved. 

Seinor staff understood the benefits of utilizing a central GIS available to the entire staff. As well, they had the insight to select a database structure that was open and standardized rather than closed source or proprietary. RMU’s chosen geospatial consultant, Cloudpoint, had experience with both the Multi-Speak and Local Government information models.  

After several planning meetings and explanation of system-specific terms, the CAD vector data geometry was able to be imported into the Multi-Speak model using the same Esri software that RMU had purchased. In order to insure completeness and accuracy, electric department staff had open and frequent updates and conversation with Cloudpoint. Every attempt was made to keep the data as intuitive and close to the previously used CAD naming conventions as possible while still adhering to standards of an open information model. 

During the same time as this CAD to GIS data conversion, Esri server software (ArcGIS Server) was installed on a dedicated web server for internal use. In the course of this first phase of deployment the intension of staff was to keep the digital infrastructure private to a select group of RMU personnel familiar with the data. However, the software technology was installed and configured with the ultimate goal of deploying the map services as the final product out in the field in a connected tablet environment. 

Even though the Electric Department’s data was an obvious priority, some attention and time was paid to development of other basemap layers. RMU had participated for years in the Ogle County GIS consortium without realizing the full potential and usefulness of that group’s data offerings. Inserting these datasets into the local government model allowed RMU to grasp a fuller picture of their complete GIS eco-system.  

Along with their meticulous CAD drawing, electric department staff had collected over 22,000 photos of their 7,286 electric poles. These data, while extremely useful, was only available on one PC within the electric department offices. Again, with the intension of eventually pushing this information out to field personnel, Cloudpoint moved these photos into the cloud. Because of the foresight of RMU staff and the naming of these 22,000+ photos, a linkage could be drawn from the poles feature class to the images themselves while on a protected and redundant  webserver within Amazon Web Services S3 storage. This link is currently being used on the desktop as well as in the field. 

Internally to the RMU network, there are currently only a few editors of the electrical GIS layers.  While this seems inefficient it actually is an industry-wide ‘Best practice’. Using Esri server-side software (ArcSDE) riding on-top of Microsoft Sequel Server the electric data is currently a protected enterprise dataset. This means that though many have access to see the authoritative data, only a select and qualified few have access to change it. These different versions of the data are synchronized after the author approves the edits. This reconcile and post process can be done on the GIS server by qualified staff. 

During the continued database development stage, sharing was done via ArcMap and a set of shared folders and File Geodatabases. This full-featured software program from Esri has a high learning curve. In order to completely “see” the same layers, users needed to be proficient enough to create layer files, change symbology and then save pathnames as relative or UNC path types. This potential road bump was avoided by utilizing maps created by ArcGIS Online  and disseminating the information via secured webmaps. 

This large step forward allowed the electrical department field crews to use hand-held tablets to see map images & data, aerial imagery, address locations, pole photos, as well as PDF manuals of their departmental standards. RMU purchased four - Apple iPads equipped with 4G LTE and enrolled them in a Cisco Mobile Device Management software solution for protection and accountability.  While this is not an Automatic Vehicle Location (AVL) solution, it speeds up response time and efficiency of truck crews by being able to know what they need to replace before ever ever arriving on site. 

The ease of access this allowed garnered a welcomed reception from the field crews and sparked a desire to have more complete and faster updates. This step required the involvement of RMU IT staff to push the previously mentioned map service as provided by ArcGIS Server out to a secured location on the web. In order to effectively and safely open a port in a network’s firewall, many precautions needed to be adhered to. This implementation is no different. Cloudpoint worked with RMU staff as the translator between GIS terminology and their network to achieve both security and speed requirements. This effort was reinforced by RMU with the forward thinking purchasing of quality hardware and an ELA from Esri nearly a year prior. 

Currently, GIS in Rochelle Municipal Utilities Electric Department is in full swing. Edits to the system are changed internally and pushed out to the field crews almost instantaneously. Field personnel have a customized mapping interface that was created with several iterations and face-to-face meetings. As well, field crews can close the feedback loop by highlighting areas that are incorrect (including attaching pictures) or changing attributes of specific features within the map on their tablets. These edits are again propagated back to the office and, if approved, incorporated into the default database version. 

The GIS is not, and will never be, completely done. RMU senior staff understands that in creating these efficiencies, there will be  perpetual training and maintenance of the system. Software updates will be needed, new layers created, deployments to be made, etc… It is a dynamic infrastructure just like the electrical system that it represents. They also understand the significance of how far they have come in one short year.

Drones: A real game changer

First off: Drones have a negative connotation but are a great attention getter. The word drone has a negative feeling because of military accounts of spying and death. 90% of consumer drones are less than 5 lbs and are used mostly for a hobby (aerial imaging and photography). Fun fact = you will struggle to find drone manufacturers call their aircraft drones, they rather would call them a UAV because it does not have a negative view.

Phantom 2: Our first drone purchase was the Phantom 2. We went with a well known company (dji) so we could upgrade parts and drone bodies in the future. With our drone we also purchased a 2.4ghz datalink that connects the flight controls to an Ipad. Unfortunately this device was not made for the Phantom models. With a little modification and drone surgery, we attached the device to the main control board.

Camera: For aerial imaging, we were worried about the "fisheye" looks of many cameras people fly. We wanted a nice camera on a light drone. We had to take into consideration how we would mount it and the camera specs themselves, but especially weight. We ended up using a Ricoh GR camera that we mount to our drone using foam (vibration) and zipt-ties. 

Processing: Agisoft Photoscan Pro is a great tool. It allows for stitching of images and calculates depth images to produce 3D models and DEMS. The stitching is so good that we do not need GPS on every photo, instead we just are using ground control. Photoscan was used for Orthophoto generation as well as 3d Point Cloud Extraction. Initial experiments have proved that precise measurement can be taken off the 3d models!

Processing POWER: Cloud processing provides a power without breaking the bank! The RAM dramatically helps in creating a mesh. It went from 16 hours to 30 minutes with the difference from 8gb. 

Results: 3D models, DEM's, Orthophoto's, Video's, Building extraction, Point Cloud Generation, Etc.

Disclaimer: In compliance with FAA safety regulations, we flew the drone on private land and under 400 feet. We also complied with airport zone restrictions and the demo was used for internal (non-commercial) uses. 

Piecing the Plots together: High-Accuracy cemetery GIS

It's safe to say that the smaller the block, parcel, or lot; the more difficult it can be to accurately represent your features in a GIS system.  When it comes to cemetery lots, this can be just the case as we start to go from feet to tenths to inches.  If your objective is to just locate a grave with respect to a certain area or section within the cemetery, then maybe a simple smart phone app searching for relative points may be all you need.  However, if you need to see the layout of lots, blocks, and graves, using polygons to identify specific graves (which may be the case for cemetery management tools) then high-accuracy GPS is the way to go.

This sample project consisted of collecting cemetery markers with a Trimble Geo-XH 6000 (cm Edition) GPS unit to obtain high-accuracy coordinates which were used as control points to lay out the blocks, lots, and graves or the cemetery.  Once the layout was completed, GIS data was populated from an existing database of information obtained from personnel responsible for managing the cemetery.  OK, so your next question is "where does the high quality imagery come from?".  Google??? NO, this was actually collected with a unmanned aerial vehicle (UAV or commonly known as a drone) outfitted with GPS guidance and a professional grade camera.  You can read more about the drone project in separate upcoming blog.  The surrounding ground around the cemetery markers was painted with a white "X" to be used as ground control points when stitching the photos together.  The final map was served up as a feature service on ArcGIS Server and can be searched by last name using the magnifying glass search tool in the top right corner.  Notice how the head stones appear in the aerial image with precise accuracy over their designated grave polygon.  There will be more on these tools and methodology to come.


View Larger Map

Roanoke Apostolic Christian cemetery location...

ArcPad - Customized not Commercialized

When looking for a solution to better their data and increase productivity, the city of Rock Falls, Illinois did not want a box solution. A city that has owned its own utilities (Including electric) for over 100 years, they did not want to change what practices were working to fit into someones package. The electric department spearheaded the efforts to implement a field GIS that would allow workers to update, edit, and view data. After looking at data privacy and structure, it was soon realized that ESRI's ArcPad was going to be the best solution. 

ArcPad was decided upon for a few key reasons, but the ability to be customized to fit existing workflows made it the perfect solution. Because of offline editing, unique forms, and relationships, the city decided to pursue this unique route. 

The city is using Lenovo touch screen tablets running Windows 8.1, allowing them to have easy field functionality. Custom toolbars allow them to filter and sort layers and custom forms allow for data population. The unique forms allowed for the city's electric department to tie all the attributes to the pole layer to replicate existing utility workflows.

Overall, the use of custom ArcPad solutions greatly benefited the city. It allowed them to keep existing workflows while capturing better and current data. Time was spent upfront on custom programming of forms and buttons for ease of use, but keeping it simple is the best way to get the field crews to adapt to it. Complex box solutions might "do it all" but getting buy-in from all users is key to making the overall project a success for years to come.

Story Map of a Work Trip

During the week of March 22-29th I had the opportunity to go back to Reynosa, Mexico. The first time I made this trip, I took only my son and 11 others. This event was larger with 24 folks from my church and I took my entire family (6 of us). 

I had been looking for an opportunity to create an Esri Story Map for one reason or another. Just to get the professional experience (configuration, coding and what-not). This trip finally provided good reason to do that and maybe some explanation to our customers of why I was completely off the grid for 7 days.  Reynosa Story

Story Maps are the latest iteration of your Uncle Ted showing your family slides of his trip to the Badlands on your cousins bedsheets over TV Dinners. It's a nice display when the data calls for a map but awkward of it doesn't. If you look at images and ask, "OK where is this now?", that's a time for a story map.  As you can see below, It's cross-platform and responsive. 

If you would like help in setting up a story map, let us know. After having do one I can see all kinds of applications, local government as well as private. 

And if you'd like to ask question about my trip to Reynosa. I'd love to, but lets keep business out of it; micahwilli@gmail.com

Creating Line Features in the Field (Snap!)

Need to create line features in the field? Grab a tablet, the Collector App for ArcGIS supports point, lines and polygon creation and editing. Wait, but what about connectivity? If the lines are created on a touch screen device they are going to be as accurate as…well as drawing things with your finger, right? No worries. If you have ArcGIS for Desktop Standard, you have the Snap tool available to you, which will help you out. Once you’re done making your field additions, you can bring the data back into Desktop and run Snap to ensure coincidence of features. You could just consider it the most useful markup method ever. (!)

Ingredients

AGOL Organizational Acct

Editable Feature Service(s) accessible on AGOL

ArcGIS for desktop Standard

Mobile Device

Before & After The red line was created in the field with Collector on iPad. The blue line has been snapped to the poles layer using the gp tool:

Important:Ensure vertices are added at (or near) every coincidence location while creating line features, as you will need them later for this process.

Note: This method may be possible without Organizational Account/Collector but is very likely not near as fluid.